All initiatives have identified outcomes, timelines, and measures. The KPIs listed below will be measured annually at a minimum.
- The President’s Focused Learner Program
- Engagement in program
- Participation or completion of tasks assigned within the PFL
- Enrollment based on engagement
- RPG over long term
- FLIGHT
- Engagement in program
- RPG over long term
- Sense of belonging surveys
- Focus groups
- Evaluation of Transfer Credit
- List of feeder schools
- Number of courses being added to student records
- Number of course transfer credits awarded
- Number of unique students impacted
- Improving outcomes in first-year critical courses
- DFWI rates
- Course enrollment and fill rates
- Early Alert engagement
- Midterm Grade reporting engagement
- Supplemental Instruction/Tutoring engagement
- Faculty engagement in learning communities around first year courses
Goal or targets (for each KPI):
We wish to see the long-term improvements in RPG rates for our new student population. We are also seeking continual improvement of program measures.
Current Status:
- The President’s Focused Learner Program
As of spring 2024, there were 2,219 enrolled students involved with the PFL program:
- FA20 cohort enrolled in SP24: 410 students
- FA21 cohort enrolled in SP24: 520 students
- FA22 cohort enrolled in SP24: 593 students
- FA23 cohort enrolled in SP24: 683 students
- Opt-In cohort enrolled in SP24: 13 students
1,920 (86.5%) of PFL students from Spring 2024 reenrolled in Fall 2024.
A number of events were hosted in spring 2024, designed to connect students to resources on campus, such as tutoring, advising, writing center, career and professional development, and campus wellbeing.A registration assistance event (“Registration Triage”) was also held to coincide with time tickets opening for spring 2024 registration.
- Total PFL coaching appointments in Spring 2024: 63 appointments
- Total programmatic offerings in Spring 2024: 16 events and workshops
- Total event attendance for Spring 2024: 260 check-ins
- FLIGHT
In our third year with the FLIGHT program, we have increased our collaborations with the campus partners to encourage FLIGHT students to get involved across the three classes and added smaller events to enhance connections early. As of this date we have a total of 13,410 interactions of FLIGHT students this fall 2024. In AY23-24, we reported 636 for FLIGHT26 and 6,582 for FLIGHT27 students. These are not unique users
We are working with Institutional Research to capture progression data for FLIGHT27 students and expect to see positive results that are comparable to the FLIGHT26 first-time full-time retention rate after 1 year of 78.7%. Additionally, we are working to align the participation of FLIGHT students and their progression for FLIGHT26 and 27, now that we have had two classes running simultaneously. After one year of tracking the FLIGHT 26 students, our data indicated that participation in FLIGHT events contributes positively to academic progression. Students who participated in FLIGHT events had a higher average GPA of 3.09 and a progression rate of 70%. In contrast, students who did not participate had a lower average GPA of 2.88 and a progression rate of 63%.
Our post-event survey after the Football Runout event did not yield a good response rate and we will be working with Institutional Research to send an email at the end of fall 2024 to learn whether their engagement positively impacted their affect towards the KSU community.Our expectation is that the responses will indicate positive results comparable to the FLIGHT 27 results last year where 92% of students who did participate reported feeling a sense of community at KSU. Some highlights from last year’s report about the Football Runout event include the following responses from FLIGHT 27:
- 79% made at least one new connection with another FLIGHT27 student.
- 96% are proud to be a FLIGHT27 student.
- 94% are likely to attend future KSU events.
- 95% are proud to be a KSU student.
- 96% feel like they are part of FLIGHT27.
- Evaluation of Transfer Credit
Evaluation for the year is still underway. We do expect to see a lower rate of credits awarded because this year ‘s review will only include new incoming students; whereas last year the analysis and credit awards were reviewed for all students at the time. Last year’s baseline demonstrated a significant increase. Given those changes were successful, we should expect to establish an expected rate for one year by which future years will be compared.
- Improving outcomes in first-year critical courses
In Fall 2024, Full Term courses maintained a high fill rate of 90% and experienced a 6.32% increase in enrollment. Seven Week Session I saw a slight decrease in capacity utilization, from 79% filled in Fall 2023 to 72% in Fall 2024. Seven Week Session II enrollment rose marginally, with the fill rate going up from 74% in Fall 2023 to 76% in Fall 2024. Learning Support Full Term courses saw a sharp increase in the fill rate, from 1042% in Fall 2023 (likely indicating high demand relative to seat availability) to 167% in Fall 2024, suggesting efforts to address the demand. These trends suggest strong, steady demand for Full Term courses, while shorter or support-oriented sessions may need adjustments to better match student needs.
There were small improvements in the DFWI rates in MATH 1190 Calculus I, in Fall 2023 and Spring 2024 which could be the result of several initiatives including more access to support services and the creation of a new course (MATH 1179 Calculus for Life Sciences). Unfortunately, DFWI rates for Math 1111 College Algebra and 1113 Precalculus were not as positive. MATH 1111 remained steady in Fall 2023 compared to Fall 2022, but increased in Spring 2024 compared to Spring 2023. For MATH 1113, DFWI rates for Fall and Spring increased by 5% over Fall 2022 and 2% points over Spring 2023.
Interventions like Supplemental Instruction (SI) and tutoring through the SMART Center continue to show benefits in general. Students who engage with SI and tutoring typically have higher mean grades, higher pass rates, and lower DFWI rates than the students who do not by significant margins.
Supplemental Instruction Fall 23 & Spring 24
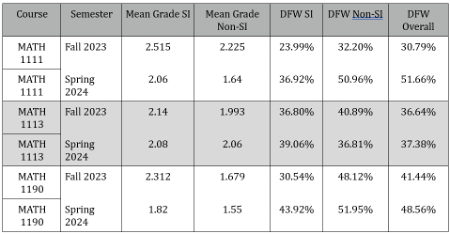
SMART Center Fall 23 & Spring 24

In Early Alerts, final overall participation rate for Fall 2024 was 75%. This is up from 71% in Fall 2023 and 74% in Spring 2024. The participation rate for faculty teaching in our “Critical Courses” was 77%. In Midterm Grades, in Fall 2023 the midterm grade participation rate was 42% and the Fall 2024 midterm grade participation rate was 65%. The participation rate for midterm grades in Critical Courses went from 45% to 70%.